Biology · DFT · Computation
2023
PD-1 Immunotherapy Drug Study
Running quantum chemistry on a cancer drug target at 17.
PD-1 is a protein that sits on the surface of T-cells and acts as a brake on the immune system. When it engages with its ligand PD-L1, it tells the T-cell to stand down. Tumors exploit this. They express PD-L1 to hide from immune detection, effectively telling the immune system not to attack. Cancer immunotherapy drugs that block this interaction have been among the most significant advances in oncology in the last decade. I wanted to understand the chemistry underneath.
At 17, I joined a faculty-led research group at St. Xavier's College working on quantum chemical studies of biologically active molecules. I was the only student on the team. The project was a DFT analysis of a PD-1 prodrug: a small molecule inhibitor targeting the PD-1 checkpoint pathway.
What we were computing
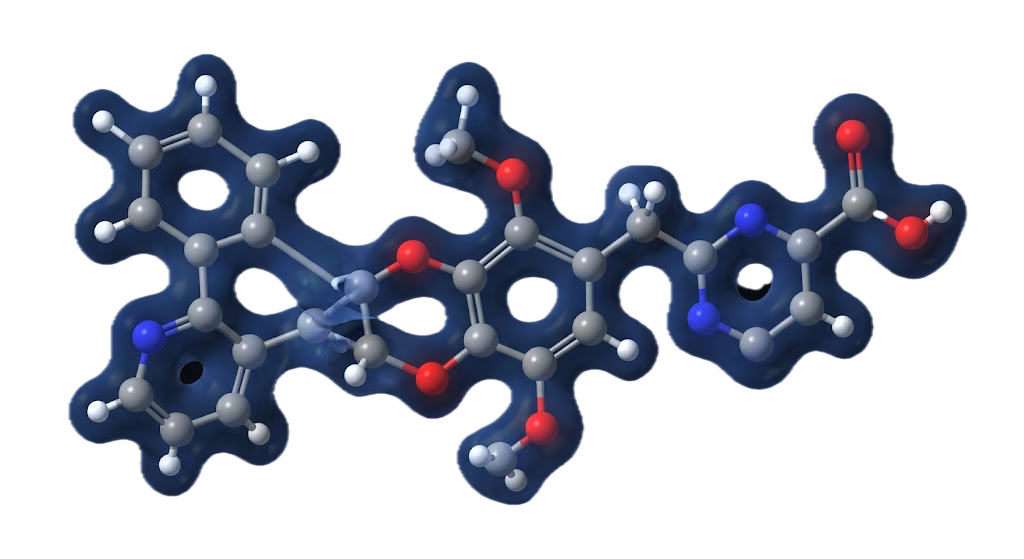
The molecule has the molecular formula C29H33NO5. Before you can reason about how it interacts with a biological target, you need to understand its electronic structure: where the electrons are concentrated, how reactive different sites are, how the molecule responds when it gains or loses charge in a physiological environment.
We ran the study across three charge states: anion, cation, and neutral. The rationale is that a molecule in solution can exist in different ionization states depending on the local pH and environment. A drug candidate that looks stable in one charge state might be highly reactive in another, and the reactive sites shift with charge. Understanding all three states gives a more complete picture of the molecule's behavior in a biological context.
All calculations used DFT with the B3LYP functional and the 6-311G(d) basis set, run in Gaussian09W. Structure visualization and analysis used GaussView 5.0. DOS spectra were calculated using GaussSum 3.0. The geometry was first optimized by scanning the potential energy surface across dihedral angles at 10-degree intervals to find the minimum energy configuration in each charge state. The minimum energies were obtained at 0 degrees dihedral for all three states.
HOMO-LUMO analysis
The HOMO-LUMO gap is a measure of molecular reactivity. A small gap means the molecule is reactive and can easily donate or accept electrons. A large gap means it is chemically stable. For drug molecules, this matters because it determines how the molecule interacts with its biological target.
In the anion state, the alpha and beta orbital gaps were 5.12 eV and 5.83 eV respectively. In the cation state, the alpha gap was 5.03 eV, but the beta gap collapsed to 0.31 eV. That small gap in the cation beta mode was the most striking result of the study. It indicates unusually high reactivity in that orbital under cationic conditions, which has direct implications for how the molecule might behave when protonated in a low-pH environment like a tumor microenvironment. The neutral state showed a gap of 4.93 eV, consistent with moderate reactivity.
Molecular electrostatic potential mapping
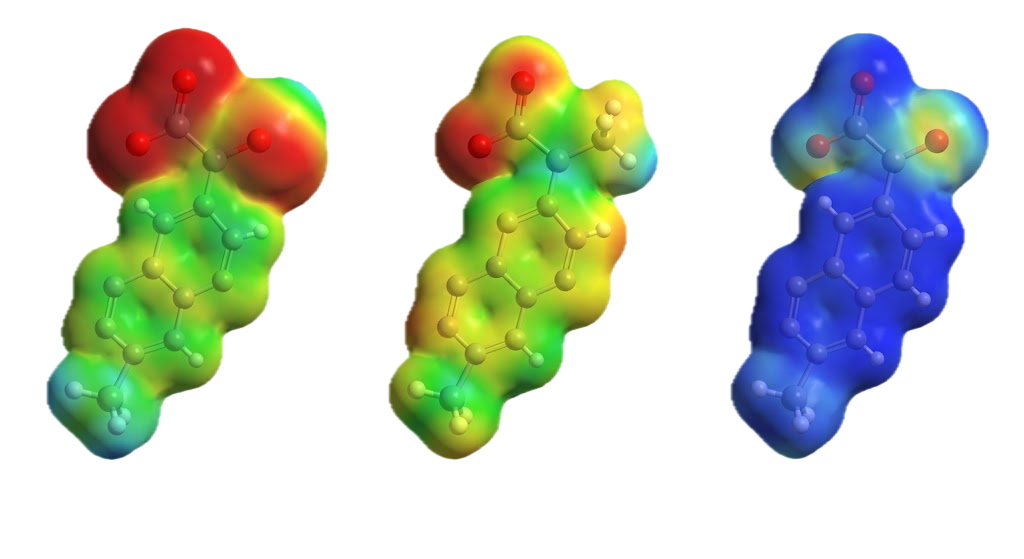
MEP mapping color-codes the electron density surface by electrostatic potential. Red and orange regions are electron-rich and susceptible to electrophilic attack. Blue regions are electron-poor and susceptible to nucleophilic attack.
In the anion state, the surface was dominated by greenish-yellow, indicating widespread electron-rich regions and broad electrophilic susceptibility. The cation state flipped this almost entirely to blue, indicating electron depletion and nucleophilic susceptibility across most of the surface. The neutral state showed a mixed picture with concentrated red regions at the oxygen atoms, which are the most electronegative atoms in the structure and expected to be the primary reactive sites.
These maps tell you where to look when designing an inhibitor. If you want a molecule that binds strongly to PD-1 through electrostatic complementarity, you need to know which sites on the drug candidate are available for that interaction, and how that availability changes with charge state.
Vibrational analysis and isotope labeling
The vibrational frequency analysis identified the characteristic modes of the molecule across all three charge states. The O2-C13 carbonyl stretch, one of the most diagnostic vibrational modes in the molecule, appeared at 1762 cm⁻¹ in the anion and neutral states and 1759 cm⁻¹ in the cation, all with high TED (Total Energy Distribution) percentages indicating strong localization of that mode.
Isotope labeling, replacing hydrogen with deuterium and doing the same for carbon, nitrogen, and oxygen atoms, produced significant frequency shifts throughout the spectrum. The shifts were largest in modes dominated by the labeled atoms, which confirmed the assignments and validated the computational model against expected isotope effects.
What this work taught me
This was my introduction to quantum chemistry in a research setting. Before this project, DFT was something I had read about. By the end of it, I had run hundreds of single-point energy calculations, debugged failed geometry optimizations, and learned to read vibrational spectra and density of states plots. I learned what it looks like when a calculation converges cleanly versus when it is trapped in a local minimum. I learned to question outputs rather than trust them.
The biological question behind the computation also stuck with me. Understanding why a molecule binds to a target, at the level of electron density and orbital energy, is different from knowing that it binds. Computational chemistry gives you a way to ask the deeper question. That question has the same structure as the one I am still trying to answer in materials science: not just does this material work, but why, at the level of atoms and electrons.
Links